|
MECHANICAL PROPERTIES OF PLASTICS
This section will acquaint the reader with the technical
terms and concepts used to describe the properties or performance of a material.
It is important to understand these STANDARDIZED terms since they are used by
suppliers and users to communicate how a material behaves under specific
conditions. This allows comparisons of different materials.
DESIGN
A designer or engineer will often use design equations that work with
metals while a part is being designed. Metals behave like a spring; that is, the
force generated by the spring is proportional to its length. A plot (FIGURE 2)
of the force as a function of length is a "straight line."
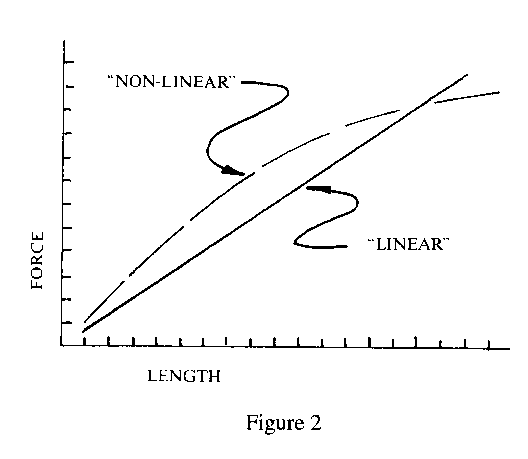
When a material actually works this way it is called
"LINEAR" behavior. This allows the performance of metals and other materials
that work like a spring to be quite accurately calculated. A problem occurs when
the designer tries to apply these same equations directly to plastics. Plastics
DO NOT BEHAVE LIKE A SPRING (not a straight line), that is they are
"non-linear." Temperature changes the behavior even more. The equations should
be used only with very special input. A material supplier may have to be
consulted for the correct input.
How much load or force will the part be required to carry?
How will the part be loaded? What are the direction and size of the forces in
the part? These are but a few of the questions that a designer tries to answer
before a material is selected.
STRESS
How does one know if a material will be strong enough for a part? If the
loads can be predicted and the part shape is known then the designer can
estimate the worst load per unit of cross-sectional area within the part. Load
per unit area is called "STRESS" (FIGURE 3).
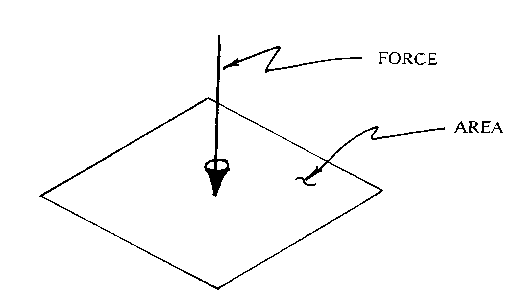
Figure 3
If Force or Load is in pounds and area is in square inches
then the units for stress are pounds per square inch.
STIFFNESS (Modulus)
Sometimes a designer knows a part can only bend or deflect a certain
amount. If the maximum amount of bending and the shape of the part are known,
then the designer can often predict how STIFF a material must be. The
measurement of the STIFFNESS of a material is called the "MODULUS" or "MODULUS
OF ELASTICITY." The higher the modulus number, the stiffer the material; and
conversely, the lower the number, the more flexible the material. The Modulus
also changes as the temperature changes. Modulus numbers are also given in
pounds per square inch.
TYPICAL TENSILE MODULUS VALUES (PSI)
(at room temperature)
|
Graphite-epoxy composites |
40,000,000 |
| Steel
|
30,000,000 |
|
Aluminum, 1000 series |
10,000,000 |
|
Epoxy-glass laminates |
5,800,000 |
|
Polyester-glass reinforced |
2,000,000 |
|
Nylons, 30% glass reinforced |
1,400,000 |
|
Acrylics |
500,000 |
| Cast
epoxy |
450,000 |
|
Polycarbonate |
450,000 |
|
Acetal, copolymer |
410,000 |
|
Polyethylene; high molecular weight |
100,000 |
STRAIN
The measurement of how much the part bends or changes size under load
compared to the original dimension or shape is called "STRAIN." Strain applies
to small changes in size.
STRAIN = (Final Length - Original Length)/Original Length
= Change in Length or Deformation/Original Length
If the change in size is in inches and the original
dimension is in inches, then the units for strain are inch per inch.
STRESS, STRAIN, and MODULUS are related to each other by
the following equation. The modulus or stiffness of a material can be determined
when the material is loaded in different ways, such as tension, compression,
shear, flexural(bending) or torsion (twisting). They will be called TENSILE
MODULUS, also know as plain MODULUS, FLEXURAL MODULUS, TORSIONAL MODULUS, etc.
MODULUS = STRESS/STRAIN
or, in other words
MODULUS = Load /change in shape when loaded. (STIFFNESS)
Choose the type of modulus in the property sheet that most
nearly duplicates what the customer expects the major load to be, tension,
bending (flexural). If the load is unknown, use the lowest moduli value of the
two. These numbers can be used for short-term loading if the load is to be
applied for only a few days at the most.
The stress/strain equation is the equation used by
designers to predict how a part will distort or change size and shape when
loaded. Predicting the stress and strain within an actual part can become very
complex. Fortunately, the material suppliers use tests that are easy to
understand.
THE PERFORMANCE OF A PLASTIC PART IS AFFECTED BY:
WHAT KIND OF LOAD THE PART WILL SEE (Tensile, Impact, Fatigue, etc.)
HOW BIG THE LOAD IS
HOW LONG OR OFTEN THAT LOAD WILL BE APPLIED
HOW HIGH AND/OR LOW A TEMPERATURE THE PART WILL SEE
HOW LONG IT WILL SEE THOSE TEMPERATURES
THE KIND OF ENVIRONMENT THE PART WILL BE USED IN. WILL MOISTURE OR OTHER
CHEMICALS BE PRESENT?
THIS IS WHERE PLASTICS DIFFER IN THEIR BEHAVIOR WHEN
COMPARED TO OTHER MATERIALS, SUCH AS METALS AND CERAMICS. CHOOSING STRESS AND/OR
MODULI VALUES THAT ARE TOO HIGH AND DO NOT ACCOUNT FOR TIME AND TEMPERATURE
EFFECTS CAN LEAD TO FAILURE OF THE PART.
Some additional terms that are used to describe material
behavior:
YIELD POINT
The yield point is that point when a material subjected to a load,
tensile, compressive, etc. gives (yields) and will no longer return to its
original length or shape when the load is removed. Some materials break before
reaching a yield point, for example, some glass-filled nylons or die cast
aluminum.
To try to further visualize this property, take a piece of
wire and slightly bend it. It will return to its original shape when released.
Continue to bend and release the wire further and further. Finally the wire will
bend and not return to its original shape. The point at which it stays bent is
the "YIELD POINT." The "yield point" is a very important concept because a part
is usually useless after the material has reached that point.
TENSILE STRENGTH
The maximum strength of a material without breaking when the load is
trying to pull it apart is shown in Figure 4. This is the system used by the
suppliers to report tensile properties in their literature, such as strength and
elongation.
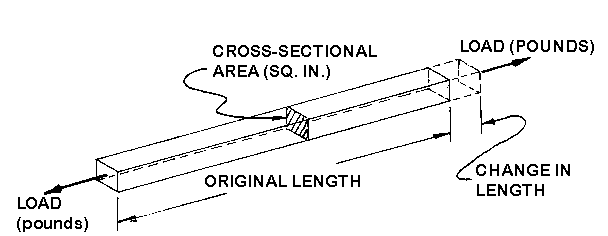
Figure 4
A good way to visualize this property is to think of
pulling a fresh marshmallow apart and then pulling a piece of taffy apart. The
force or pounds required to pull the taffy apart would be much greater than
required to pull the marshmallow apart. If that force is measured and the taffy
and marshmallow each had a cross-sectional area of one square inch, then the
taffy has the higher "tensile strength" in terms of pounds per square inch.
Plastics may demonstrate tensile strengths from 1000 psi (pounds per square
inch) to 50,000 psi.
ELONGATION
ELONGATION IS ALWAYS ASSOCIATED WITH TENSILE STRENGTH because it is the
increase in the original length at fracture and expressed as a percentage. An
example would be to pull on a 1 " wide piece of paper that is 4" long. It tears
with no visible elongation or nearly 0% elongation. Now do the same thing to a
1" x 4" piece of taffy. It will stretch several times its original 4" length
before it fractures. Assume that it is stretched to a 12" length then
(12"/4")(100)= 300% elongation (FIGURE 5).
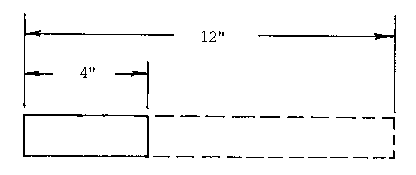
Figure 5
COMPRESSIVE STRENGTH
The maximum strength of a material without breaking when the material is
loaded as shown in Figure 6. Check if the material supplier has the information
on compressive strength, since it is not always determined.
This term becomes less meaningful with some of the softer
materials. PTFE, for example, does not fracture. Consequently, the compressive
strength continues to increase as the sample is deforming more and more. A
meaningful "compressive strength" would be the maximum force required to deform
a material prior to reaching the yield point. The compressive term similar to
"elongation" is "compressive deformation," though it is not a commonly reported
term. It is easy to visualize two identical weights (FIGURE 7), one sitting on a
1" cube of fresh marshmallow and the other on a 1" cube of taffy. The
marshmallow would be flattened and deformed more.
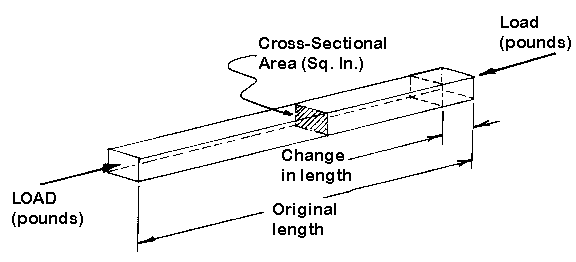
Figure 6
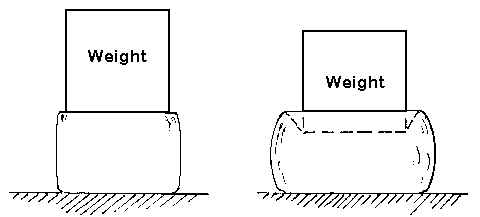
Figure 7
SHEAR STRENGTH
The strength of a material when the material is loaded as shown in Figure
8. The surfaces of the material are being pulled in opposite directions. Some
examples of items that see shear loading are the nail holding a picture on the
wall, the cleats of athletic shoes, and tire tread as a car speeds up or slows
down.
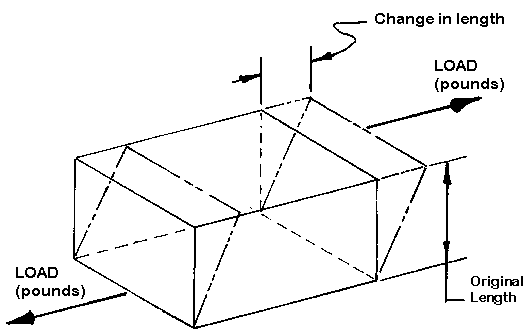
Figure 8
FLEXURAL STRENGTH
The strength of a material when a beam of the material is subjected to
bending as shown in Figure 9. The material in the top of the beam is in
compression (squeezed together), while the bottom of the beam is in tension
(stretched). Somewhere in between the stretching and squeezing there is a place
with no stress and it is called the neutral plane. A simple beam supported at
each end and loaded in the middle is used to determine the flexural modulus
given in properties tables. Skis, a fishing pole, a pole vault pole, and a
diving board are examples of parts needing high flexural strength.
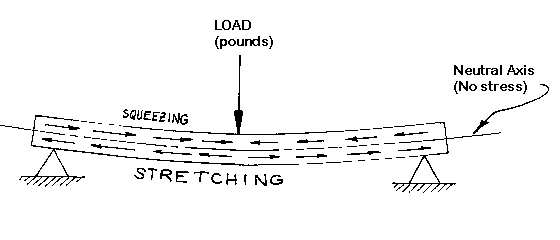
Figure 9
TORSIONAL STRENGTH
The strength of a material when a shape is subjected to a twisting load as
shown in Figure 10. An example of a part with a torsion load is a screw as it is
being screwed in. The drive shaft on a car also requires high torsional
strength.
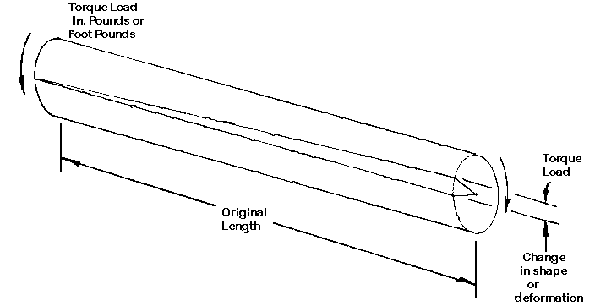
Figure 10
POISSON'S RATIO
Sometimes a designer will need a value for Poisson's Ratio. This ratio occurs
in some of the more complex stress/strain equations. It sounds complicated, but
it is simply a way of saying how much the taffy (material) necks down or gets
thinner in the middle when it is streched (FIGURE 11). Its value is most often
between .3 to .4 for plastic materials. Check supplier literature for specific
information.
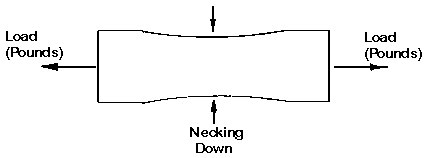
Figure 11
Figures 12 through 16 show the tensile strain curves for
different types of materials. REMEMBER TO THINK OF PULLING ON DIFFERENT KINDS OF
TAFFY; THAT IS, SOFT AND WEAK, HARD AND BRITTLE, ETC.
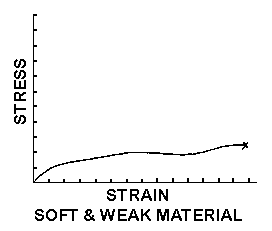
Figure 12
|
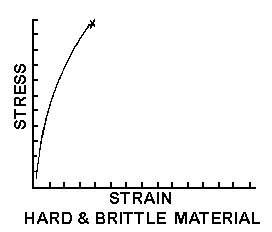
Figure 13
|
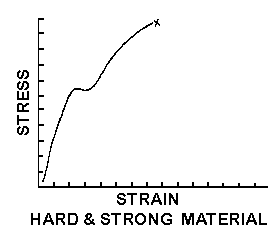
Figure 14
|
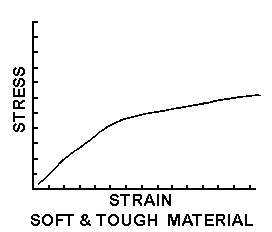
Figure 15
|
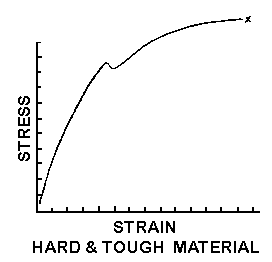
Figure 16
Figure 17 shows how a plastic material can appear stiffer
and stronger if it is pulled apart faster. An example of rate sensitivity is
when we can't pull a string apart, but we can snap it apart.
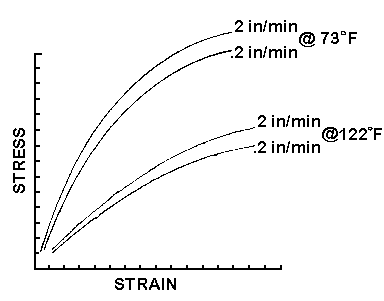
Figure 17
Figure 17 also shows how the material is softer and weaker
at higher temperatures, like wax. Plastics are also affected by low temperatures
and many become more brittle as the temperature goes down.
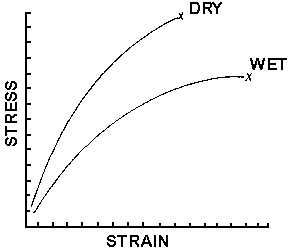
Figure 18
Figure 18 shows the effect of moisture in the atmosphere on
the properties of a material like nylon. The dry material is hard and brittle
while the wet material is softer and tougher. This is like comparing uncooked
spaghetti to cooked spaghetti.
Typical tensile yield strengths of some materials (psi)
| Low
alloy hardening steels; wrought, quenched, and tempered |
288,000 |
| High
strength low alloy steels; wrought, as rolled |
80,000
|
|
Aluminum casting alloys |
55,000
|
|
Aluminum alloys, 1000 series |
24,000
|
|
Polyphenylene Sulfide, 40% glass reinforced |
21,000
|
|
Acetal, copolymer, 25% glass reinforced |
18,500
|
|
Nylons, general purpose |
12,600
|
|
Acetal, homopolymer |
10,000
|
|
Acrylics |
10,000
|
|
Acetal, copolymer |
8,800
|
|
ABS/Polycarbonate |
8,000
|
|
Polypropylene, general purpose |
5,200
|
|
Polypropylene, high impact |
4,300
|
Creep
Visualize large weights being hung on bars of different materials. All
materials will experience some initial and immediate deformation or stretching
when the load is first applied. As long as the yield point has not been
exceeded, a metal sample which acts like a spring will not stretch any more
regardless of how long the weight is left on. When the weight is removed, the
metal bar will return to its original shape. The length of a "thermoplastic" bar
will continue to slowly increase as long as the load is applied. This is called
CREEP. The amount of creep increases as the load and/or temperature are
increased. Some thermoplastics like nylons will creep more when they have
softened because of the presence of moisture. The "crosslinked" or "3D net"
structure in "thermosets" resists creep better than thermoplastics.
Reinforcements like glass and carbon, which do not creep, greatly reduce the
creep of the composite material when mixed with a plastic.
Remember the relationship between stress/strain/modul is:
Modulus = Stress/Strain
The initial strain or change in length with the weight will give a value for
the modulus (this is usually the short term value reported in the property
tables for the tensile modulus or flexural modulus). If the weight (stress) is
left on over a period of time, the amount of bending or elongation continues to
increase and the value for the modulus will decrease with time as shown in
Figure 16. This decreasing modulus that is a function of time (and even
temperature) is called the "CREEP MODULUS" or "APPARENT MODULUS."
THIS IS THE MODULUS THAT THE DESIGNER SHOULD BE USING TO MORE ACCURATELY
PREDICT THE BEHAVIOR OF THE PLASTIC MATERIALS. THE VALUE CHOSEN FROM THE
SUPPLIER'S LITERATURE WILL BE BASED ON THE ESTIMATED TIME THE LOAD WILL BE
APPLIED, THE AMOUNT OF THE LOAD, AND THE TEMPERATURE CONDITIONS PRESENT WHEN THE
LOAD IS TO BE APPLIED.
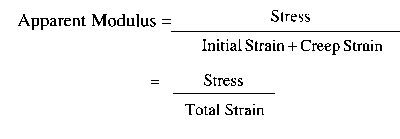
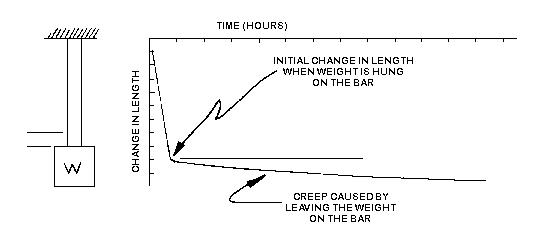
Figure 19
REMEMBER THAT CREEP IS AFFECTED BY:
LOAD (STRESS)
TEMPERATURE
LENGTH OF TIME THE LOAD IS APPLIED
OTHER ENVIRONMENTALS, SUCH AS MOISTURE OR CHEMICALS
Since the STRESS is kept constant, i.e., the weight or load
is not changed or removed, the equation becomes:
Apparent Modulus x Total Strain = Constant (Stress)
or in other words, if the strain goes up, then the Apparent
Modulus must come down. Since the strain increases with time and temperature,
the Apparent Modulus decreases with time and temperature.
The data is sometimes presented in supplier literature in
terms of Stress Relaxation. This means that the STRAIN is held constant and the
decrease in the load (stress) is measured over time. This is called "STRESS
RELAXATION''. This information is important for applications, such as gaskets,
snap fits, press fits, and parts joined with screws or bolts. The equation
becomes:
Apparent Modulus / Stress = Constant (Strain)
or in other words, as the stress goes down because the
material moves, then the apparent modulus also goes down.
Sometimes a supplier will recommend a maximum design
stress. This has a similar effect to using the apparent modulus. The recommended
design stress for some acrylic injection molded parts is 500 psi and yet its
tensile strength could be reported to be as much as 10,000 psi in the property
chart. Designers will often look at the 10,000 psi value and cut it in half to
be safe; however, it is not really enough and could lead to failure of the part.
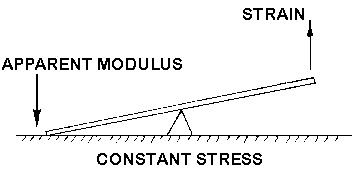
Figure 20
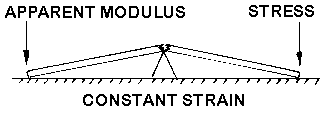
Figure 21
Figure 22 shows the Tensile Elongation of a Material as a
function of Time at Various Stress Levels. Think about pulling a piece of taffy
to help visualize what is happening. The X indicates that the test bar broke.
Notice how the elongation is significantly reduced as the stress level is
reduced. A stress level is finally reached where the creep is nearly negligible.
THESE VALUES WILL BE THE STRESS LEVELS RECOMMENDED AS DESIGN CRITERIA.
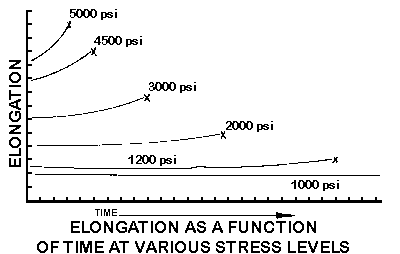
Figure 22
Figure 23 shows one of the ways the creep data is often
presented in literature. The time scale is usually over a very long time,
hundreds and more often thousands of hours. Most of the literature will compress
the time scale for ease of reading with the use of a logarithmic scale along
that axis.
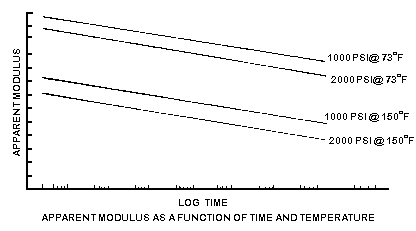
Figure 23
FATIGUE STRENGTH
Plastics, as well as other materials, subjected to cyclic loading will
fail at stress levels well below their tensile or compressive strengths. The
combination of tension and compression is the most severe condition. This
information will be presented in S-N Curves or tables. The S-N stand for
Stress-Number of cycles. A PART WILL SURVIVE MORE CYCLES IF THE STRESS IS
REDUCED. The stress can be reduced by reducing the deflection and/or decreasing
the thickness of a part.
Some examples of cyclic loading are a motor valve spring or
a washing machine agitator. With time, parts under cyclic loading will fail;
however, properly designed and tested they will not fail before several million
loadings have been completed.
Figure 24 shows a typical S-N curve.
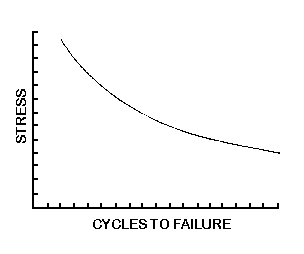
Figure 24
IMPACT STRENGTH
Many plastics demonstrate excellent impact strength. Impact strength is
the ability to withstand a suddenly applied load. Toughness is usually used to
describe the material's ability to withstand an impact or sudden deformation
without breaking. No single test has yet been devised that can predict the
impact behavior of a plastic material under the variety of conditions to which a
part can be subjected. Many materials display reduced impact strength as the
temperature is lowered. Thermosets and reinforced thermoplastics may change less
with changes in temperature. Check the supplier literature for any unusual
factors that may affect the impact performance of a part.
Some of the impact tests commonly used in supplier
literature are:
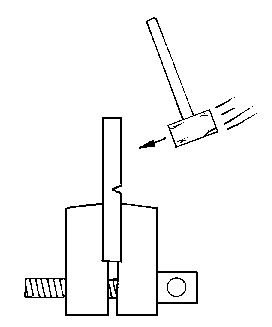
Figure 25
Izod Test: designed to measure the effect of a sharp notch
on toughness when the test specimen is suddenly impacted.
Tensile Impact Test: designed to measure the toughness of a
small specimen without a notch when subjected to a sudden tensile stress or
load.
Gardner Impact Test: drops a shaped weight and determines the
energy required to break the test sample.
Brittleness Temperature Test: determines ability of the
material to continue to absorb impacts as the temperature is decreased.
Special tests may need to be devised to more nearly duplicate
the actual application.
Figure 26
INFORMATION PROVIDED BY THESE TESTS WILL AID IN CHOOSING
MATERIAL CANDIDATES; HOWEVER, THE DESIGNER MUST STILL TEST THE ACTUAL PART UNDER
CONDITIONS AS NEAR AS POSSIBLE TO ACTUAL USE CONDITIONS BEFORE BEING CONFIDENT
THAT THE MATERIAL SELECTION IS ADEQUATE.
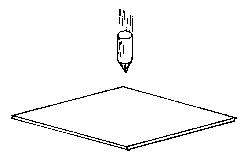
Figure 27
NOTCH SENSITIVITY
Some plastic materials have exceptional impact performance
and very good load carrying capability; however, the performance of a material
can be greatly reduced by having sharp corners on the part. The sharp corners
can be part of the design or from machining operations. A SHARP CORNER IS A
GREAT PLACE FOR A CRACK TO START. The Izod impact strength of a tough material
like polycarbonate is reduced from 20 to 2 as the radius of the notch is reduced
from 0.020"R to 0.005"R respectively.
The sharp corners not only reduce the impact resistance of a
part, but also allow for a stress concentration to occur and encourage the
premature failure of a load carrying part.
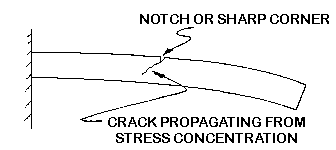
Figure 28
MINIMIZING SHARP CORNERS MAY MAKE THE MACHINING OPERATION
MORE DIFFICULT; HOWEVER, IT MAY BE CRUCIAL TO THE PART'S SUCCESS.
Edges of sheet being used in impact applications like glazing
must also be finished to be free of sharp notches. This is a concern with
acrylics and even tough materials like polycarbonate.
THERMAL PROPERTIES
With a change in temperature, plastics materials tend to change size
considerably more than other materials, such as steel, ceramics, and even
aluminum. A designer must consider these differences in the sizes. In fact, the
shipping environment may expose the part to a much greater temperature variation
than the part will ever see in use. The measure of how much a part changes size
as the temperature changes is called the "THERMAL COEFFICIENT OF EXPANSION".
COEFFICIENT OF EXPANSION
The units are usually given in inches per degree Fahrenheit. It is the
change in length (inches) of one inch of a part caused by changing the
temperature one degree.
TYPICAL COEFFICIENTS OF EXPANSION (in/in/F)
|
Polyethylene |
.000140 |
|
Acrylics |
.000060 |
|
Acetal, copolymer |
.000047 |
|
Polycarbonate |
.000037 |
|
Aluminum, 1000 series |
.000013 |
|
Polycarbonate, 30% glass reinforced |
.000009 |
|
Steels |
.000008 |
| Glass
|
.000004 |
Example: assuming an acrylic material, how much will a 10 inch dimension change
if the temperature changes 40�F?
The change in length = Original length x the coefficient of
expansion x the change in temperature
= 10 x .00006 x 40 = .024 inches
DEFLECTION TEMPERATURE UNDER LOAD
In addition to changing size, the strength and modulus of elasticity of
plastic materials tend to decrease as the ambient temperature increases. The
standard test for determining the DEFLECTION TEMPERATURE UNDER LOAD (DTUL) at 66
and 264 psi provides information on the ability of a material to carry a load at
higher temperatures. The 66 psi means a light load and the 264 psi means a heavy
load on a beam. The temperature of the loaded beam is raised until a certain
amount of deflection is observed. The temperature when that deflection is
reached is called the DTUL. Plastics usually have a higher DTUL at 66 psi than
264 psi because of the lower load.
Note: The DTUL is sometimes referred to as the Heat Distortion Temperature or
HDT.
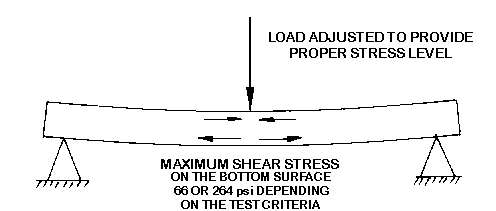
Figure 29
TYPICAL DEFLECTION TEMPERATURES, LOADED TO 264 psi (F)
|
Silicon materials |
850
|
|
Nylons, 30% glass reinforced |
495
|
|
Epoxy, mineral, glass reinforced |
400
|
|
Acetals, glass reinforced |
325
|
|
Polycarbonates |
295
|
|
Nylons, general purpose |
220
|
|
Acrylics |
180
|
|
Propylene, general purpose |
140
|
Impact strength is also affected by changes in temperature in most plastic
materials. The changes in strength can be significant, especially as the
temperature is lowered. Check the supplier literature carefully.
THERMAL CONDUCTIVITY
Plastics are good thermal insulators; that is, heat does not travel through
them easily. We experience this every time we pick up a hot pan by its plastic
handle. The "CONDUCTIVITY" of plastics is 300 to 2500 times poorer than most
metals. This property shows why it takes a long time for a casting or other
molded parts to cool down in the middle. Internal stress can be set up in a
material because of the differences in the cooling rates between the outside of
a part and the core
| 

 Knowledge Base


 Knowledge Base


 Knowledge Base