|
Thermal Properties of
Polymers
Polymer Glass Transition
In the study of polymers and their
applications, it is important to understand the concept of the
glass transition temperature, Tg. As the temperature
of a polymer drops below Tg, it behaves in an
increasingly brittle manner. As the temperature rises above the Tg,
the polymer becomes more rubber-like. Thus, knowledge of Tg
is essential in the selection of materials for various
applications. In general, values of Tg well below room
temperature define the domain of elastomers and values above room
temperature define rigid, structural polymers.
This behavior can be understood in terms of
the structure of glassy materials which are formed typically by
substances containing long chains, networks of linked atoms or
those that possess a complex molecular structure. Normally such
materials have a high viscosity in the liquid state.
When rapid cooling occurs to a temperature at which the
crystalline state is expected to be the more stable, molecular
movement is too sluggish or the geometry too awkward to take up a
crystalline conformation. Therefore the random
arrangement characteristic of the liquid persists down to
temperatures at which the viscosity is so high that the material
is considered to be solid. The term glassy has come to be
synonymous with a persistent non-equilibrium state. In fact, a
path to the state of lowest energy might not be available.
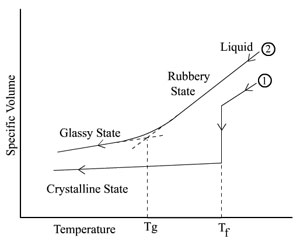
To become more quantitative about the
characterization of the liquid-glass transition phenomenon and Tg,
we note that in cooling an amorphous material from the liquid
state, there is no abrupt change in volume such as occurs in the
case of cooling of a crystalline material through its freezing
point, Tf. Instead, at the glass transition
temperature, Tg, there is a change in slope of the
curve of specific volume vs. temperature, moving from a low value
in the glassy state to a higher value in the rubbery state over a
range of temperatures. This comparison between a crystalline
material (1) and an amorphous material (2) is illustrated in the
figure below. Note that the intersections of the two straight
line segments of curve (2) defines the quantity Tg.
The specific volume measurements shown here,
made on an amorphous polymer (2), are carried out in a
dilatometer at a slow heating rate. In this apparatus, a sample
is placed in a glass bulb and a confining liquid, usually
mercury, is introduced into the bulb so that the liquid surrounds
the sample and extends partway up a narrow bore glass capillary
tube. A capillary tube is used so that relatively small changes
in polymer volume caused by changing the temperature produce
easily measured changes in the height of the mercury in the
capillary.
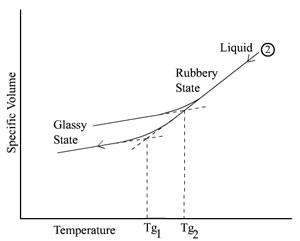
The determination of Tg for
amorphous materials, including polymers as mentioned above, by
dilatometric methods (as well as by other methods) are found to
be rate dependent. This is schematically illustrated in the
figure below, again representing an amorphous polymer, where the
higher value, Tg2, is obtained with a substantially
higher cooling rate than for Tg1.
We can understand this rate dependence in
terms of intermolecular relaxation processes. Since a glass is
not an equilibrium phase, its properties will exhibit a time
dependence, or physical aging. The primary portion of the
relaxation behavior governing the glass transition in polymers
can be related to their tangled chain structure where cooperative
molecular motion is required for internal readjustments. At
temperatures well above Tg, 10 to 50 repeat units of
the polymer backbone are relatively free to move in cooperative
thermal motion to provide conformational rearrangement of the
backbone. Below Tg, the motion of these individual
chains segments becomes frozen with only small scale molecular
motion remaining, involving individual or small groups of atoms.
Thus a rapid cooling rate or "quench" takes rubbery material into
glassy behavior at higher temperatures (higher Tg).
While the dilatometer method is the more
precise method of determining the glass transition temperature,
it is a rather tedious experimental procedure and measurements of
Tg are often made in a differential scanning calorimeter (DSC).
In this instrument, the heat flow into or out of a small (10 � 20
mg) sample is measured as the sample is subjected to a programmed
linear temperature change. This will be discussed in the next
section. There are other methods of measurement such as density,
dielectric constant and elastic modulus which are treated in
texts on polymers. These methods are, of course, also rate
dependent.
Tg and Mechanical
Properties
Another important property of polymers, also
strongly dependent on their temperatures, is their response to
the application of a force, as indicated by two main types of
behavior: elastic and plastic. Elastic
materials will return to their original shape once the force is
removed. Plastic materials will not regain their shape. In
plastic materials, flow is occurring, much like a highly viscous
liquid. Most materials demonstrate a combination of elastic and
plastic behavior, showing plastic behavior after the elastic
limit has been exceeded.
Glass is one of the few completely elastic
materials while it is below its Tg. It will remain
elastic until it reaches its breaking point. The Tg of
glass occurs between 510 and 560 degrees C, meaning that it will
always be a brittle solid at room temperature. In comparison,
polyvinyl chloride (PVC) has a Tg of 83 degrees C,
making it good, for example, for cold water pipes, but unsuitable
for hot water. PVC also will always be a brittle solid at room
temperature.
Adding a small amount of plasticizer
to PVC can lower the Tg to � 40 degrees C. This
addition renders the PVC a soft, flexible material at room
temperature, ideal for applications such as garden hoses. A
plasticized PVC hose can, however, become stiff and brittle in
winter. In this case, as in any other, the relation of the Tg
to the ambient temperature is what determines the choice of a
given material in a particular application.
A striking example of the rate dependence of
these viscoelastic properties is furnished by Silly Putty. Slowly
pulling on two parts of the Silly Putty stretches it apart until
it very slowly separates. Placing the Silly Putty on a table and
hitting it with a hammer will shatter it.
The above images are representative of the
behavior of a material above and below its glass transition
temperature. The image on the (left) is Silly Putty that has been
slowly stretched. The image on the (right) is Silly Putty which
has been hit with a hammer. The speed of the hammer raised the
rate of the application of the force and in turn raised the Tg.
This caused the Silly Putty to react as if it were below its Tg
and to shatter. Even though both reactions took place at the same
ambient temperature, one reaction appeared to be above the
effective Tg and the other appeared to be below.
Our focus has been on amorphous polymers in
the preceding discussion but we have hardly touched on their
mechanical properties. A further complication arises in dealing
with general polymers from their semi-crystalline morphology in
which amorphous regions and crystalline regions are intermingled.
This gives rise to a mixed behavior depending on the percent
crystallinity and on their temperature, relative to Tg
of the amorphous regions. You are referred to texts on polymer
science for basic discussion of these topic but the inhomogeneity
of the material and its characteristics presents interesting
analytical challenges.
Differential Scanning
Calorimetry
In differential scanning calorimetry (DSC),
the thermal properties of a sample are compared against a
standard reference material which has no transition in the
temperature range of interest, such as powdered alumina. Each is
contained in a small holder within an adiabatic enclosure as
illustrated below.
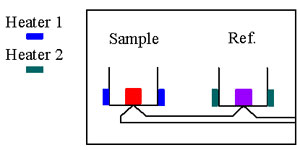
The temperature of each holder is monitored by
a thermocouple and heat can be supplied electrically to each
holder to keep the temperature of the two equal. A plot of the
difference in energy supplied to the sample against the average
temperature, as the latter is slowly increased through one or
more thermal transitions of the sample yields important
information about the transition, such as latent heat or a
relatively abrupt change in heat capacity.
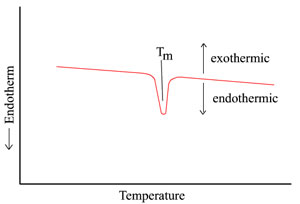
The glass transition process is illustrated in
the figure below for a glassy polymer which does not crystallize
and is being slowly heated from below Tg.
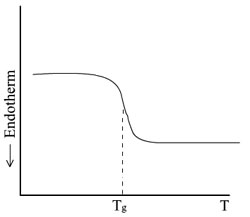
Here, the drop marked Tg at its
midpoint represents the increase in energy supplied to the sample
to maintain it at the same temperature as the reference material,
due to the relatively rapid increase in the heat capacity of the
sample as its temperature is raised through Tg. The
addition of heat energy corresponds to this endothermal
direction.
A melting process is also illustrated below
for the case of a highly crystalline polymer which is slowly
heated through its melting temperature:
Again, as the melting temperature is reached,
an endothermal peak appears because heat must be preferentially
added to the sample to continue this essentially constant
temperature process. The peak breadth is primarily related to the
size and degree of perfection of the polymer crystals.
Note that if the process were reversed so that
the sample were being cooled from the melt, the plot would be
inverted. In that case, as both are being cooled by ambient
conditions, even less heat would need to be supplied to the
sample than to the reference material, in order that crystals can
form. This corresponds to an exothermal process.
Use of the DSC will be illustrated again in
the section on liquid crystals in connection with the
identification of their phase transitions. An interesting
exercise for the reader would be to predict the general form of a
DSC plot for a semicrystalline polymer which has been rapidly
quenched from the melt to a temperature below Tg. In
the DSC plot, assume the temperature is slowly increased from
this value below Tg to a value well above, thus
allowing for significant increases in the chain mobility as
temperatures above Tg are reached so that some
crystallization can begin, well before the melting point is
reached.
Processing Polymers
Once a polymer with the right properties is
produced, it must be manipulated into some useful shape or
object. Various methods are used in industry to do this.
Injection molding and extrusion are widely used to
process plastics while spinning is the process used to
produce fibers.
Injection Molding
One of the most widely used forms of plastic
processing is injection molding. Basically, a plastic is heated
above its glass transition temperature (enough so that it will
flow) and then is forced under high pressure to fill the contents
of a mold. The molten plastic in usually "squeezed" into the mold
by a ram or a reciprocating screw. The plastic is allowed to cool
and is then removed from the mold in its final form. The
advantage of injection molding is speed; this process can be
performed many times each second.
Extrusion
Extrusion is similar to injection molding
except that the plastic is forced through a die rather than into
a mold. However, the disadvantage of extrusion is that the
objects made must have the same cross-sectional shape. Plastic
tubing and hose is produced in this manner.
Spinning
The process of producing fibers is called
spinning. There are three main types of spinning: melt, dry, and
wet. Melt spinning is used for polymers that can be melted
easily. Dry spinning involves dissolving the polymer into a
solution that can be evaporated. Wet spinning is used when the
solvent cannot be evaporated and must be removed by chemical
means. All types of spinning use the same principle, so it is
convenient to just describe just one. In melt spinning, a mass of
polymer is heated until it will flow. The molten polymer is
pumped to the face of a metal disk containing many small holes,
called the spinneret. Tiny streams of polymer that emerge from
these holes (called filaments) are wound together as they
solidify, forming a long fiber. Speeds of up to 2500 feet/minute
can be employed in spinning.
Following the spinning process, as noted in
the section on Polymer Morphology, fibers are stretched
substantially - from 3 to 8 or more times their original length
to produce increased chain alignment and enhanced crystallinity
in order to yield improved strength.
The Structure of Polymers More
8
| 

 Plastics Engineering


 Knowledge Base


 Knowledge Base